asgi-profiler
Request and SQL profiling for ASGI applications — Starlette and FastAPI, with SQLAlchemy and SQLModel.
from fastapi import FastAPI
from asgi_profiler import install

app = FastAPI()
install(app)  # viewer at /profiler
That is the whole integration. No settings module, no database table, no migration, no external service to run.
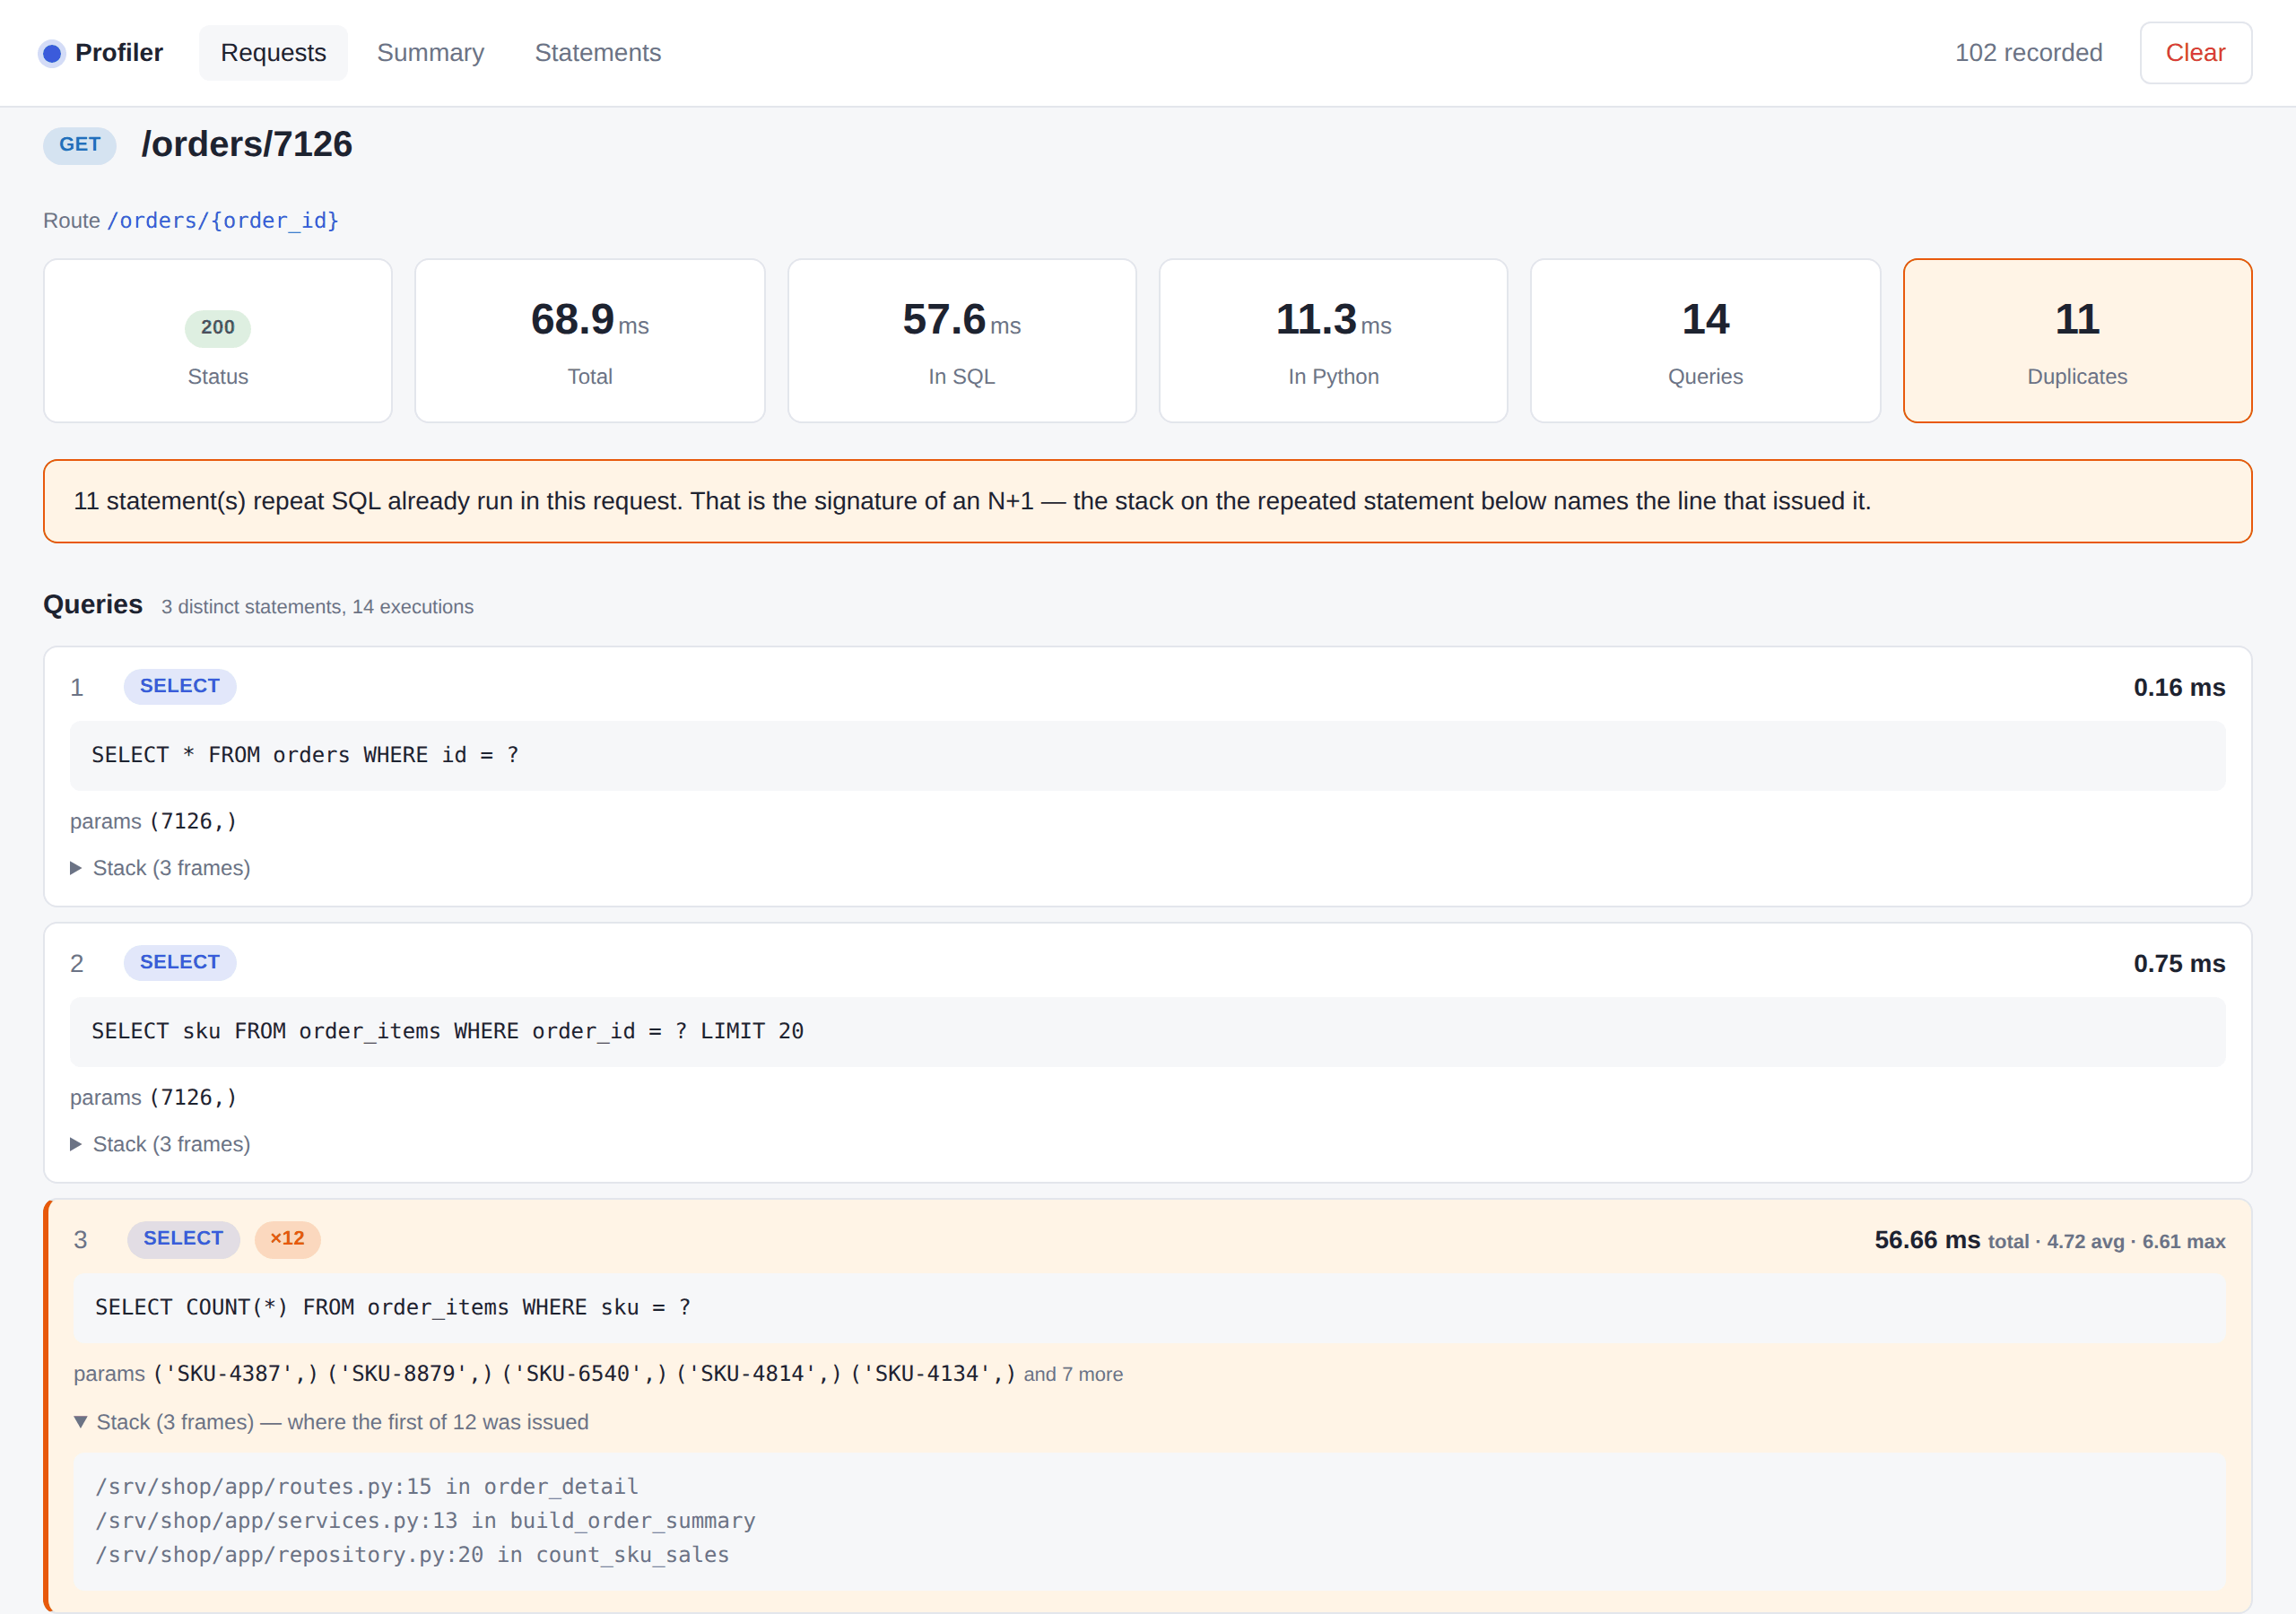
One endpoint, 68.9 ms, and 57.6 ms of it inside SQL. The same statement ran twelve times because a loop asked the database once per line item — and the stack on that statement names the three frames that did it. That is the point: not that the request was slow, but which line made it slow.
What you get
- Every request, with its status, duration, and how much of that was SQL.
- Every statement it ran, with parameters and timing.
- N+1 detection. Statements repeated within one request are grouped and flagged, with the call site that issued the first one.
- Route-pattern grouping.
/users/1and/users/2aggregate as/users/{user_id}, so the summary tells you which endpoint is slow. - Failed statements, recorded with their error rather than silently lost.
- Per-query Python stacks, walked across the greenlet boundary that SQLAlchemy's async support puts between your code and the query.
What it is not
It is not a replacement for OpenTelemetry, Prometheus or a hosted APM, and it does not try to be. Those answer "is the service healthy?" across a fleet, sampled, with infrastructure behind them. This answers "why is this endpoint slow?" on one process, recording everything, with nothing to deploy.
Run both if you like — they do not collide.